Use the wind data
you spent two years collecting

Compare candidate layouts against the wind measured at the site. When the project moves forward, the data and assumptions stay with it for operations and the bank case.

  • Ingestion health tracked per mast
  • Every AEP figure traces to its inputs
  • Met towers on the same GIS record
  • One dataset from design to bank case
Read the transcript

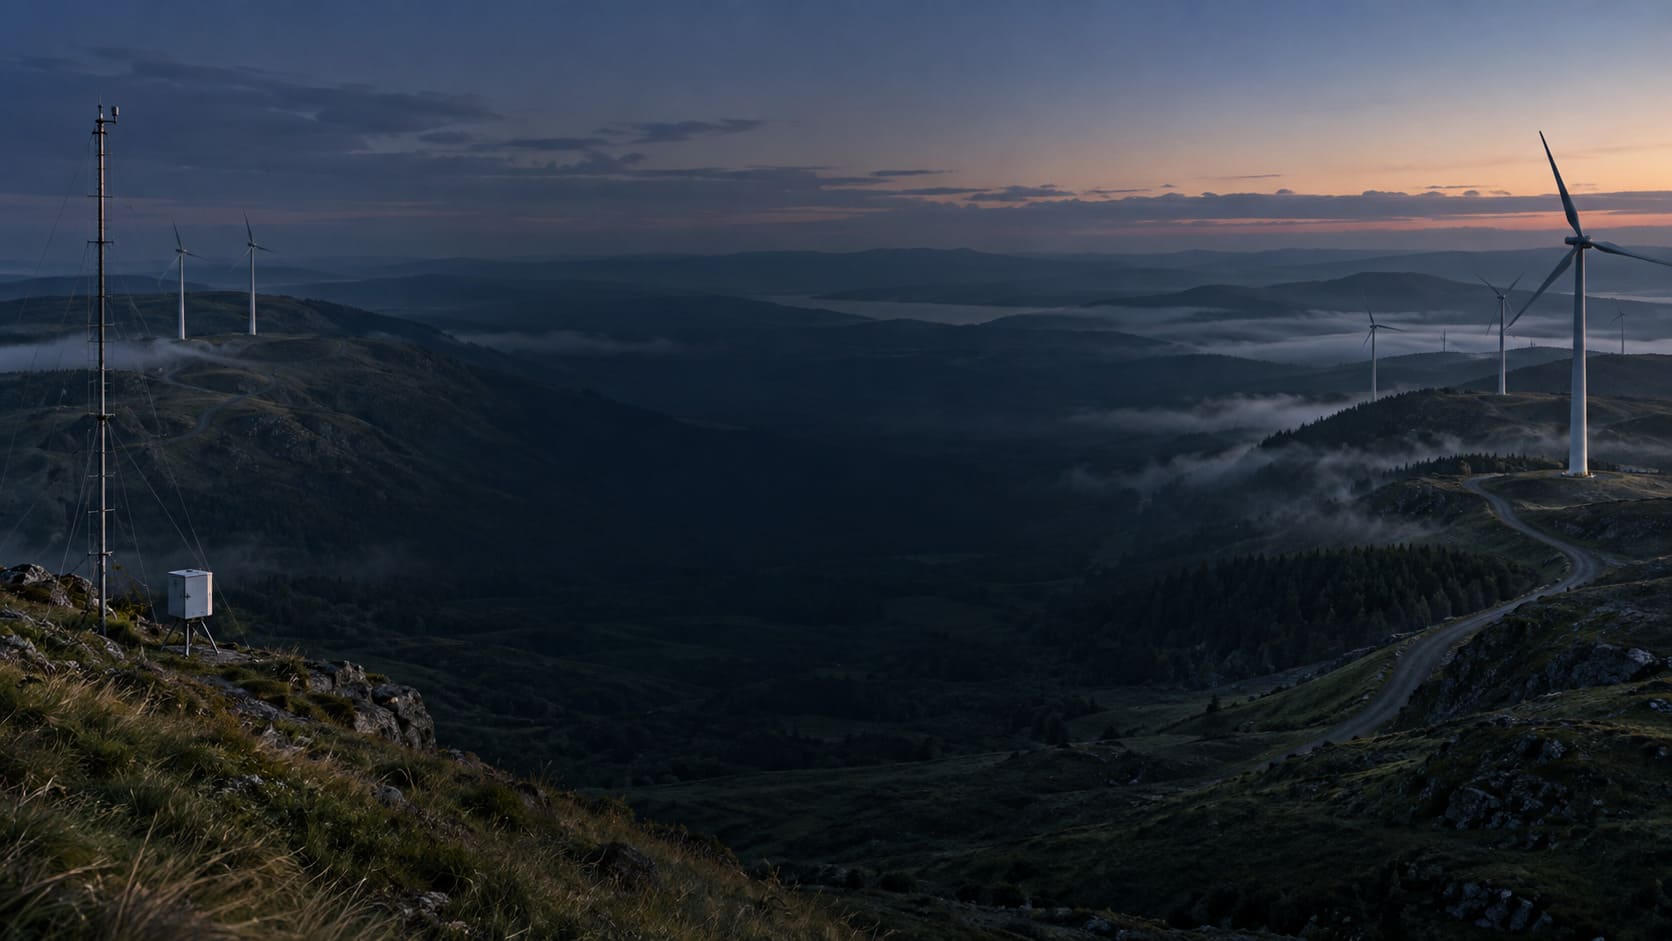
Before the first turbine, somebody stands on a ridge and listens. The listener goes up first. Two years. Every gust, every lull, measured. In most companies, two years of wind ends up in a drawer.

On Flux Energy, the ridge starts talking. Ten million measurements become a map of moving air. Satellites fill in the miles the mast can't hear. Then Flux Energy builds the farm. A thousand times.

Every layout tested against every hour the mast ever heard. Wakes, noise, roads, and cost, until the strongest design is the last one standing. Then steel replaces light. And the listening doesn't stop at groundbreak. It's handed on.

The mast's memory flows into operations and into the bank case that funds the next ridge. Flux Energy. The farm remembers its first wind.

The resource study should not disappear after development

  • A mast records the site for two years. Then the readings live on SD cards and in a consultant's PDF that nobody can re-run.
  • Layouts get designed against annual averages, not against the hours that were actually measured. Wake loss, noise limits, and setbacks are checked separately, by different people, in different tools.
  • At groundbreak the assessment stops mattering. Operations never sees it. The lender gets a number with no way back to the instrument that produced it.

From the first mast reading to the selected layout

1. Bring the measurement campaign into the project

Met towers and LiDAR campaigns are registered per site. Logger connectors pull hourly readings for speed, direction, temperature, and pressure, with ingestion health tracked so a silent gap in the record is caught the day it opens, not two years later.

2. Add reference data where the mast has gaps

Global Wind Atlas and NLR WIND Toolkit profiles import straight into a siting study, alongside the measured wind parameters, so the assessment covers the whole site, not just the mast's footprint.

3. Compare layouts against the measured wind

A study holds as many candidate layouts as you want to try. Each one is run through the wake model, Weibull energy yield per turbine, availability and electrical losses, and checked against noise, flicker, and setback constraints, returning gross AEP, wake loss, and net P50 / P90 for the layout as a whole.

4. Carry the resource case into operations

The winning layout's turbines and the met towers that justified them sit on the same GIS record operations will run from. The P50 / P90 that the lender sees is computed from that record, not retyped from a report.

A layout your team can explain and reproduce

Layouts that are reproducible

Every AEP figure traces to its wind parameters, its wake settings, and its constraints. Re-run it next year and get the same answer, or a better one with more data.

Constraints checked with the design, not after it

Noise limits, shadow flicker, setbacks and exclusion polygons live in the study. A layout that violates a hard constraint says so before anyone stakes a road.

Keep the wind data useful after siting

The mast's record doesn't stop at groundbreak. It becomes the baseline operations compares against and the resource case the bank underwrites.

Wind resource assessment, without the jargon

Before a wind farm is built, a mast spends a year or two on the site measuring the wind. That data is the whole basis for the project. At most companies, it ends up in a consultant's PDF nobody opens again.

In Flux Energy, the mast's readings load straight into the platform, and reference data fills the gaps. You lay out candidate turbine positions, and Flux Energy scores each one against the wind that was actually measured, including wake losses, noise limits, setbacks, energy yield. Pick the winner. The same wind data then follows the project into operations and into the financing model.

That's wind resource assessment with Flux Energy.

Where the resource study goes next

Bankability

The P50 the lender pulls on runs back through this study to the mast that measured it.

Operations & wake steering

The wake model that ranked the layout is the one fleet wake-steering optimizes against once it's built.

Royalty settlement

Expected production per parcel starts here; actual production settles against it every period.

Common questions

Which wake model does the layout scoring use?

A Jensen top-hat model with a per-study wake decay constant, applied sector by sector across the wind rose. Each turbine's deficit from every upwind turbine is aggregated before its energy yield is computed.

Where do the P50 and P90 come from?

From a Weibull energy yield per turbine at the wake-reduced wind speed, summed for the layout, then reduced by the study's availability and electrical-loss assumptions. The P90 applies the study's uncertainty factor to that net figure. Every input is stored with the result.

Can we compare several layouts for the same site?

Yes. A siting study holds any number of layouts, each with its own turbine positions and its own AEP run, so alternatives can be scored against the same wind parameters and the same constraints.

What if we already have a consultant's resource assessment?

Its wind parameters can be entered or imported into the study and scored alongside the measured data. Flux Energy doesn't replace the assessment. It makes it re-runnable and keeps it attached to the project.

What happens to the mast data after construction?

It stays on the site's record. Met towers remain on the GIS map next to the turbines, their readings stay queryable, and the resource case the bank underwrote is still the one operations compares actuals against.

The rest of the platform

See your site data in Flux Energy

You’ll work directly with the people building Flux Energy. We’ll load your met data and walk through the wake model, constraints, and P50 / P90 for a candidate layout.

Request a demo